


The S&P 500 index has been around in its current form for nearly 70 years (since 1957, to be exact). Over that time, we have had plenty of exceptional days, weeks, months, and years. Of course, those have also been met with the occasional market downturn. So, what does a "normal" stock market look like? What years are considered outliers, and how often do they occur? What has the S&P 500 actually averaged historically, and how much does that average depend on your starting and ending points? We will explore all of that and more as we dive into the history of the S&P 500. Below are five facts regarding the index over the last 67 years.
1. Down Markets Are Bound to Happen
We will have plenty of optimistic takes on the market to come, but it is important to set realistic expectations by beginning with the negatives. Over the last 67 years (starting with 1957), the S&P 500 has had a negative return 18 times. That math says we have had a negative calendar year 25.7% of the time, so nearly one in every four years. Over that period, the longest the market has ever gone without a negative calendar year is eight years, which happened from 1982-1989. The second-longest run of consecutive positive returns is only five years, which happened both from 1995-1998 and from 2003-2007.
So, what does this mean? On the positive side, three out of every four years since 1957 have not seen a drop in the index value. On the negative side, it means that if you started investing in the S&P 500 at any random moment in time since then, you would have experienced a down market at least once over any eight-year timespan (keep in mind, that would have been the best-case scenario). Investing in the market should be a long-term decision, and over that long term, periodic market downturns have always been an inherent aspect of that process.
2. Averages Can Be Misleading
When trying to figure out how your investments have performed over time, the most common way to an answer is usually through checking your average rate of return. With the knowledge that market returns fluctuate year-by-year, an average can help account for both the positive and negative outlier performances. Unfortunately, averages can also be manipulated, as the numbers can drastically change based on slight tweaks to the time frame, or by simply looking at a smaller timeframe.
From 1957 through 2023, the S&P 500 has averaged 8.51%. If you break that timeframe up into two periods, it looks like this: 7.13% from 1957 to 1990, and 9.93% from 1991 to 2023. Those are 33 and 34 year windows, respectively. Even with that large of a sample size, you still see an annualized 2.8% difference between those two. If we look at decades, the differences become significantly greater. The prior 10-year periods had the following returns:
2014-2023:11.02%
2004-2013:6.99%
1994-2003:10.99%
1984-1993:11.53%
1974-1983:7.09%
You would have averaged over 4% more per year investing in the exact same index for the exact same amount of time if you had just chosen to start in 1974 instead of 1984. As you evaluate your investment performance, pay attention to the amount of time that you have let your investments grow, and compare that to how the rest of the market has performed. Often, we give ourselves far more credit or blame for positive or negative performance than what we truly deserve.
3. The Longer You Hold, the Better The Odds
We mentioned above that the S&P 500 had decreased in value, on average, 25.7% of rolling 12-month periods. However, most investors are planning to be in the market for more than 12 months. How often would your return have been negative if you invested for longer? If we just go out to three years instead of one, only 16% of those 36-month windows would have had a negative return. So, increasing your investment time horizon by just two extra years would have reduced the chance of losing money by 37.7%. What if we extend to five years? In that case, only 12% of five-year windows would have had a negative return. Lastly, only 6% of any 10-year investment period would have resulted in a loss.1
You see where this trend is going. The longer you would have been willing to stay invested for, the less likely it would have been that you would have ended up with less money.
4. A Few Days Make a Major Difference
We just discussed above the importance of staying invested over a long period of time. The reason for this becomes even more important when you start to look at how the market actually moves. Rarely have we seen the return in positive market years spread out evenly amongst days, weeks, or months. The bulk of your return generally comes from just a few days, which are only able to be pointed out in hindsight. Believe it or not, if you had invested $100,000 on January 1st of 2023 and just missed out on the top 10 market days, you’d have $21,105 less by the end of the year compared to someone who had been invested the entire time.2
The individual who stayed invested would have ended up with $126,287, meaning that you would have missed out on over 80% of the total return just because you missed out on ten days. What makes things even worse is that if you missed out on the top 20 days, you would have actually lost money by the end of the year. The point is this: we don’t know when those few days each year will come, so your best chance of experiencing those gains is to simply keep your money invested.
5. Today’s Top Performers Are Likely Not Tomorrow’s
We might know that timing the market is a fool’s errand, but what about picking the right investments while you are in the market? Once again, this can be a trickier game to play than you might assume. Here are the top performing asset classes over the last decade:
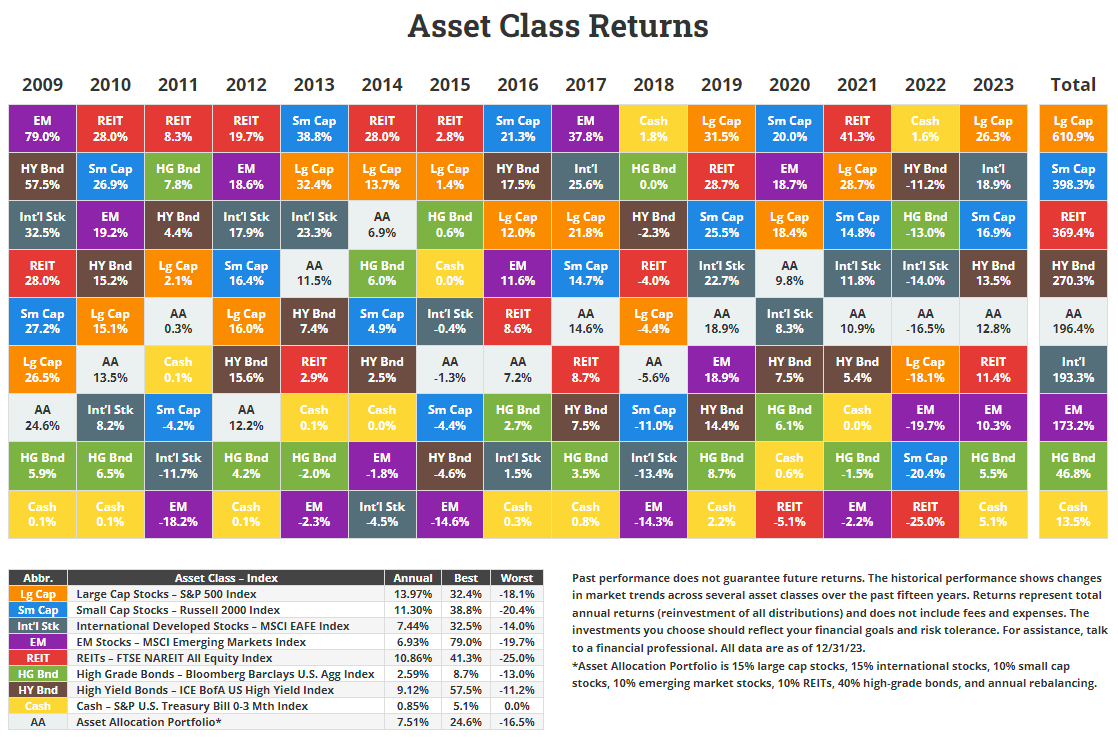
Source: https://findependencehub.com/asset-quilt-2023/
Pick any top asset class in any year, and you’ll find that it almost always fell down the board in the years to follow. Choosing certain investments because they’ve done well recently is what we like to call “chasing returns”. As you can see from the chart above, rarely does that outperformance continue for even another year or two. Whether you are looking at the S&P 500, DOW Jones, Russell 2000, or any other index, positive outlier performances rarely hold up year after year. Rather than trying to pick which assets will do the best, finding the right mix of assets that aligns with your risk tolerance will be a far greater benefit, and will allow you to keep from jumping ship when things get volatile.
Conclusion
Market returns year-by-year are unpredictable. Losses are bound to happen eventually, and they might not always occur far apart from one another. However, when viewed over a long period of time, the market gives you a chance to potentially grow your wealth even when accounting for inflation. If you had to summarize everything we have discussed so far, it would simply look like this: it is your time in the market, not the timing of it, that will ultimately give you the best chance of success.
Diversification does not guarantee a profit and cannot protect against losses in a down market.
S&P 500 Index is a market capitalization-weighted index based on the results of approximately 500 widely held common stocks. This index is unmanaged, and its results include reinvested dividends and/or distributions but do not reflect the effect of sales charges, commissions, account fees, expenses or U.S. federal income taxes.
Past performance does not guarantee future results
The information in this article is educational only, and is not intended to be a personalized recommendation for any individual(s)
1. https://www.capitalgroup.com/individual/planning/investing-fundamentals/time-not-timing-is-what-matters.html, accessed September 26th 2024
2. https://www.schwab.com/investing-principles, accessed September 26th 2024
Image: https://www.statista.com/statistics/261713/changes-of-the-sundp-500-during-the-us-election-years-since-1928/, accessed September 26th 2024